Finivo Sentinel
Earned Value. Early Warning.
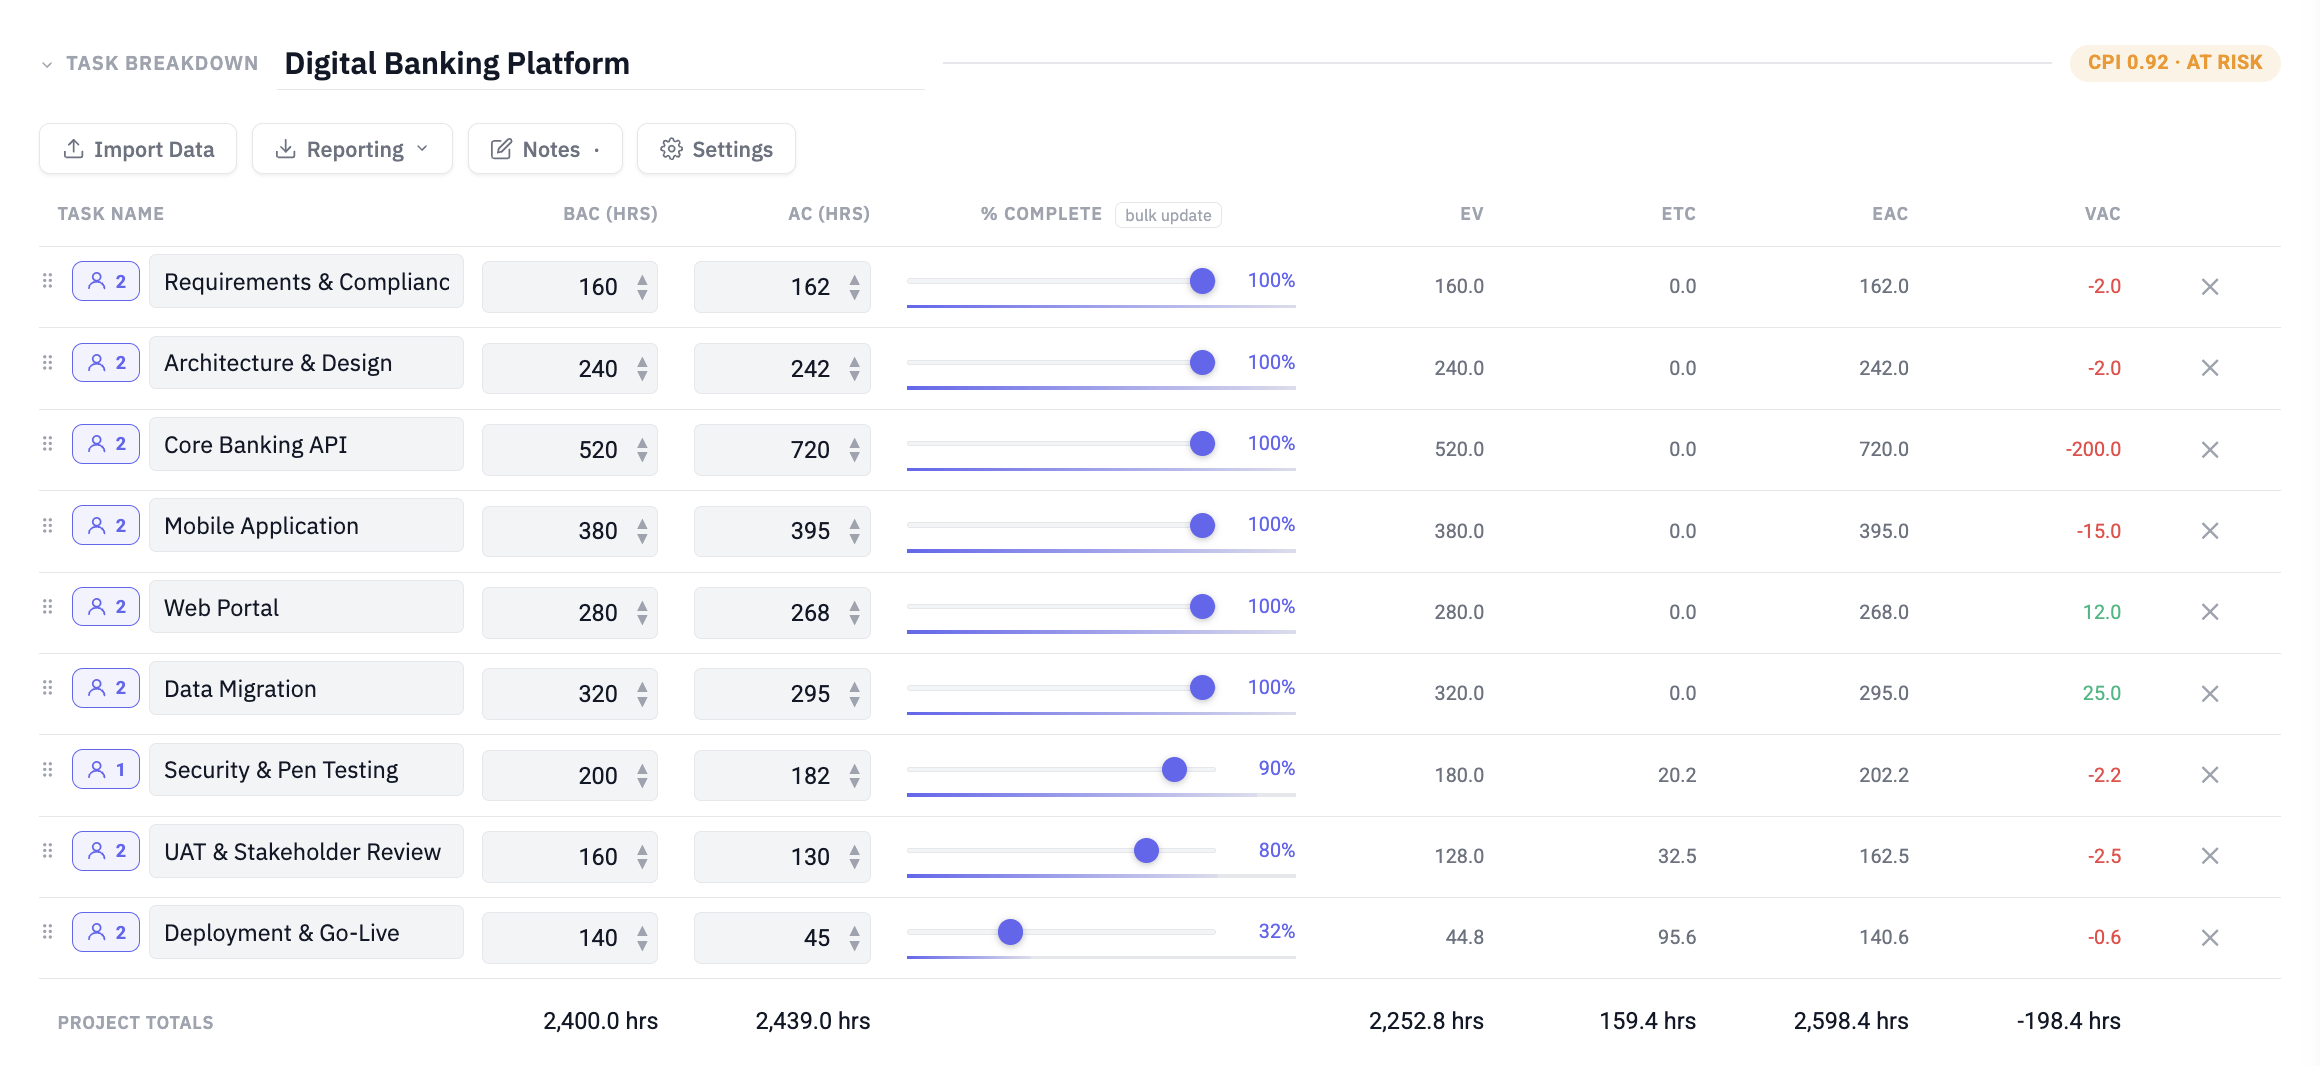
Sentinel gives you per-task EVM metrics, portfolio-level dashboards, and trend analysis. The tools you need to catch budget overruns before they happen.
Task Dashboard
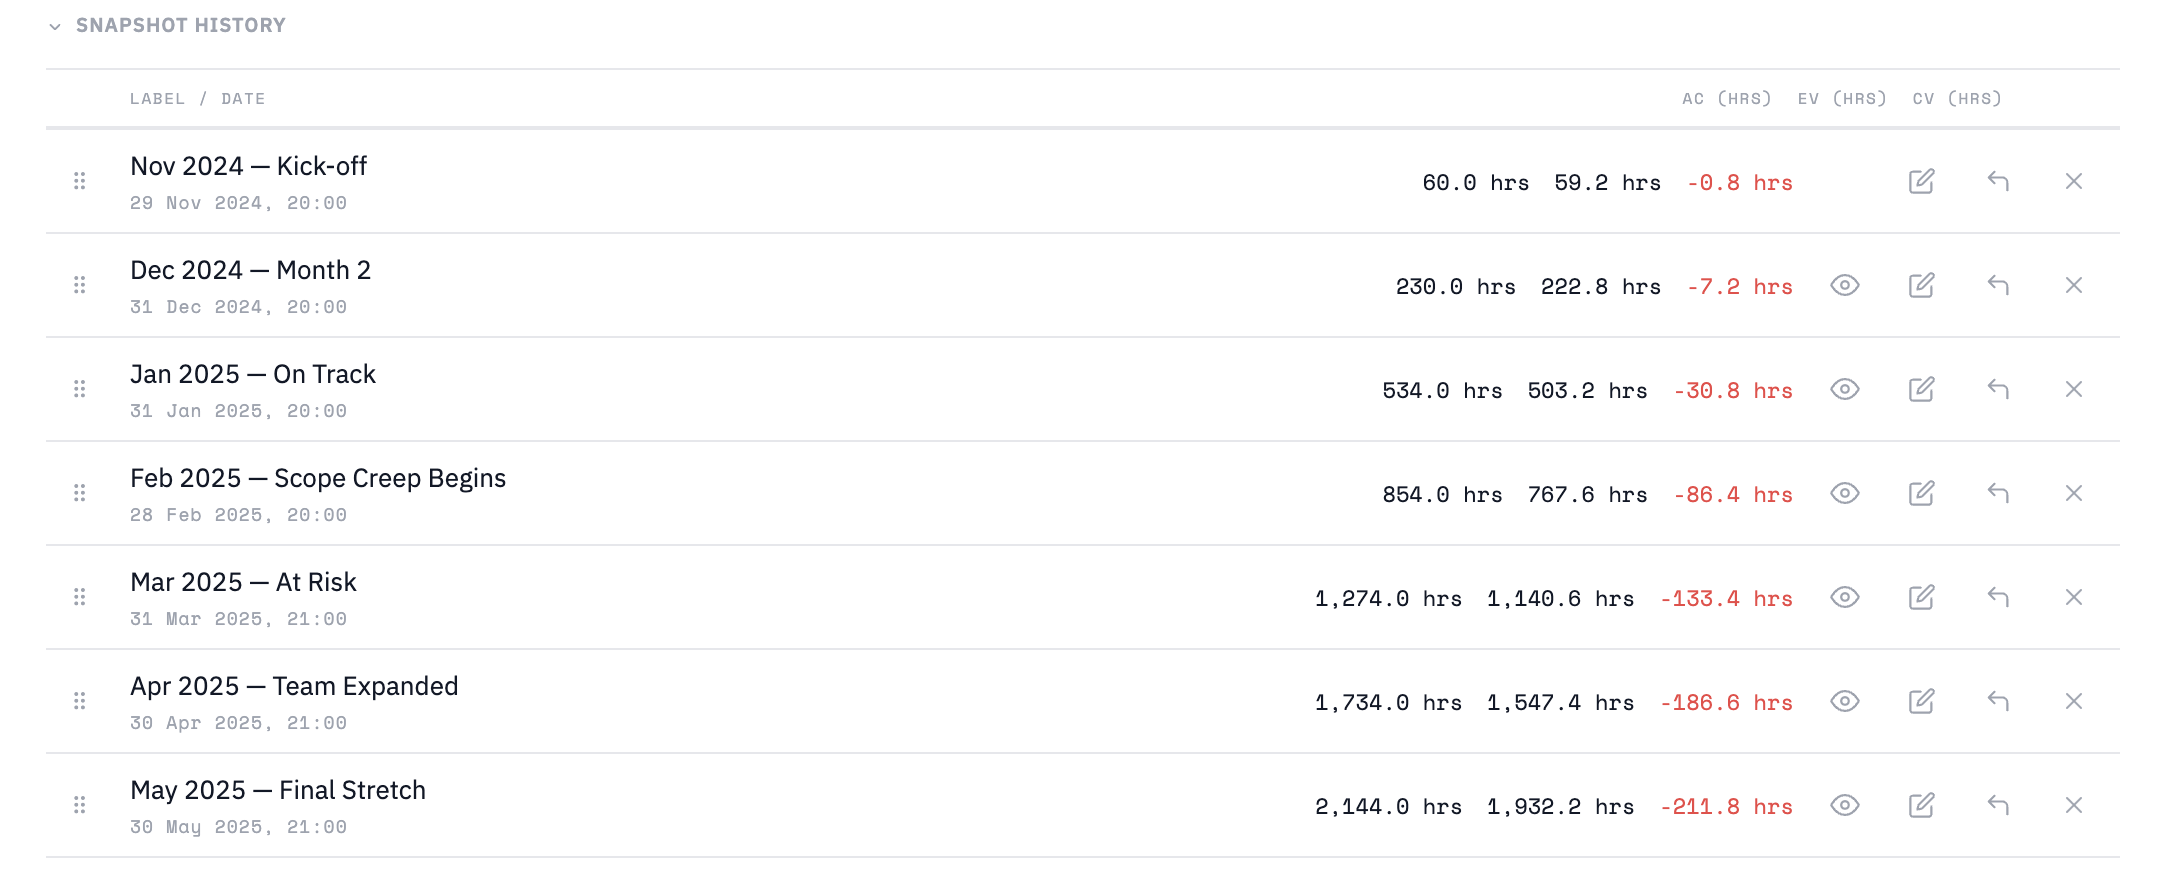
Snapshot History
Snapshot View
Cost Trend · Per Task
Nov 24
Dec 24
Jan 25
Feb–Mar
Apr–May
Jun–Jul
Aug–Sep
Oct–Dec
Budget View
BAC vs AC · Per Task
BAC
AC
Forecast View
BAC vs EAC · Per Task
BAC
EAC
Delta View
AC Delta — Jul 2025 vs Jun 2025
Task Drill-Down
Delivery Management · AC Progression
Portfolio View
Total AC · Progression
AC
EV